Extension of plot() for objects in TestDesign package
Source:R/extensions.R, R/plot_functions.R
plot-methods.RdExtension of plot() for objects in TestDesign package
# S4 method for class 'item_pool'
plot(
  x,
  y,
  type = "info",
  theta = seq(-3, 3, 0.1),
  info_type = "FISHER",
  plot_sum = TRUE,
  select = NULL,
  examinee_id = 1,
  position = NULL,
  theta_range = c(-5, 5),
  ylim = NULL,
  color = "blue",
  z_ci = 1.96,
  simple = TRUE,
  theta_type = "Estimated",
  color_final = "blue",
  color_stim = "red",
  segment = NULL,
  rmse = FALSE,
  use_segment_label = TRUE,
  use_par = TRUE,
  ...
)

# S4 method for class 'output_Static'
plot(
  x,
  y,
  type = NULL,
  theta = seq(-3, 3, 0.1),
  info_type = "FISHER",
  plot_sum = TRUE,
  select = NULL,
  examinee_id = 1,
  position = NULL,
  theta_range = c(-5, 5),
  ylim = NULL,
  color = "blue",
  z_ci = 1.96,
  simple = TRUE,
  use_par = TRUE,
  ...
)

# S4 method for class 'constraints'
plot(
  x,
  y,
  type = "info",
  theta = seq(-3, 3, 0.1),
  info_type = "FISHER",
  plot_sum = TRUE,
  select = NULL,
  examinee_id = 1,
  position = NULL,
  theta_range = c(-5, 5),
  ylim = NULL,
  color = "blue",
  z_ci = 1.96,
  simple = TRUE,
  use_par = TRUE,
  ...
)

# S4 method for class 'output_Shadow'
plot(
  x,
  y,
  type = "audit",
  theta = seq(-3, 3, 0.1),
  info_type = "FISHER",
  plot_sum = TRUE,
  select = NULL,
  examinee_id = 1,
  theta_range = c(-5, 5),
  ylim = NULL,
  color = "blue",
  z_ci = 1.96,
  simple = FALSE,
  theta_type = "Estimated",
  use_par = TRUE,
  ...
)

# S4 method for class 'output_Shadow_all'
plot(
  x,
  y,
  type = "audit",
  theta = seq(-3, 3, 0.1),
  info_type = "FISHER",
  plot_sum = TRUE,
  select = NULL,
  examinee_id = 1,
  position = NULL,
  theta_range = c(-5, 5),
  ylim = NULL,
  color = "blue",
  z_ci = 1.96,
  simple = FALSE,
  theta_type = "Estimated",
  color_final = "blue",
  color_stim = "red",
  segment = NULL,
  rmse = FALSE,
  use_segment_label = TRUE,
  use_par = TRUE,
  ...
)

# S4 method for class 'output_Split'
plot(
  x,
  y,
  type = NULL,
  theta = seq(-3, 3, 0.1),
  info_type = "FISHER",
  plot_sum = TRUE,
  select = NULL,
  examinee_id = 1,
  position = NULL,
  theta_range = c(-5, 5),
  ylim = NULL,
  color = "blue",
  z_ci = 1.96,
  simple = TRUE,
  use_par = TRUE,
  ...
)
Arguments
- x
accepts the following signatures:
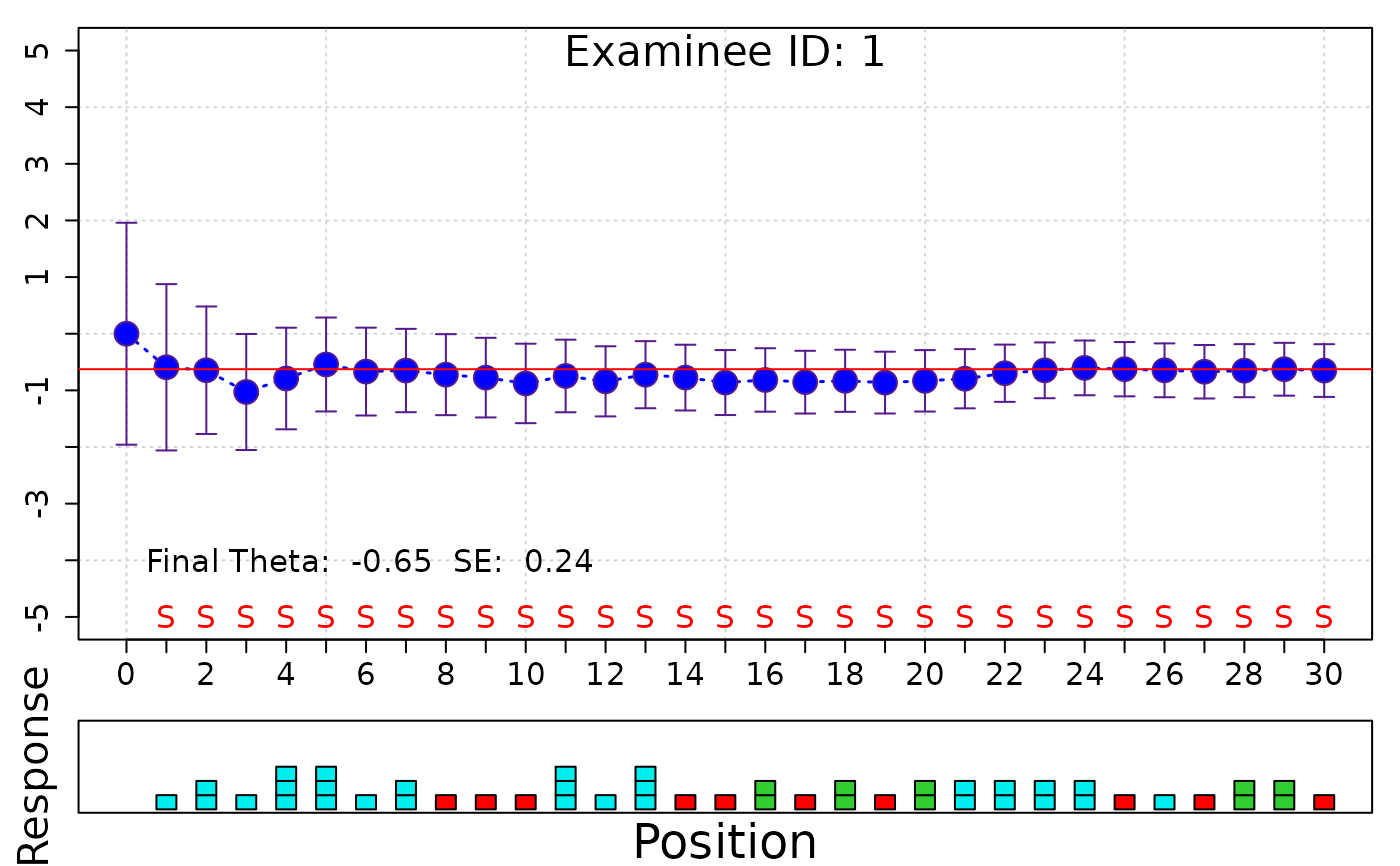
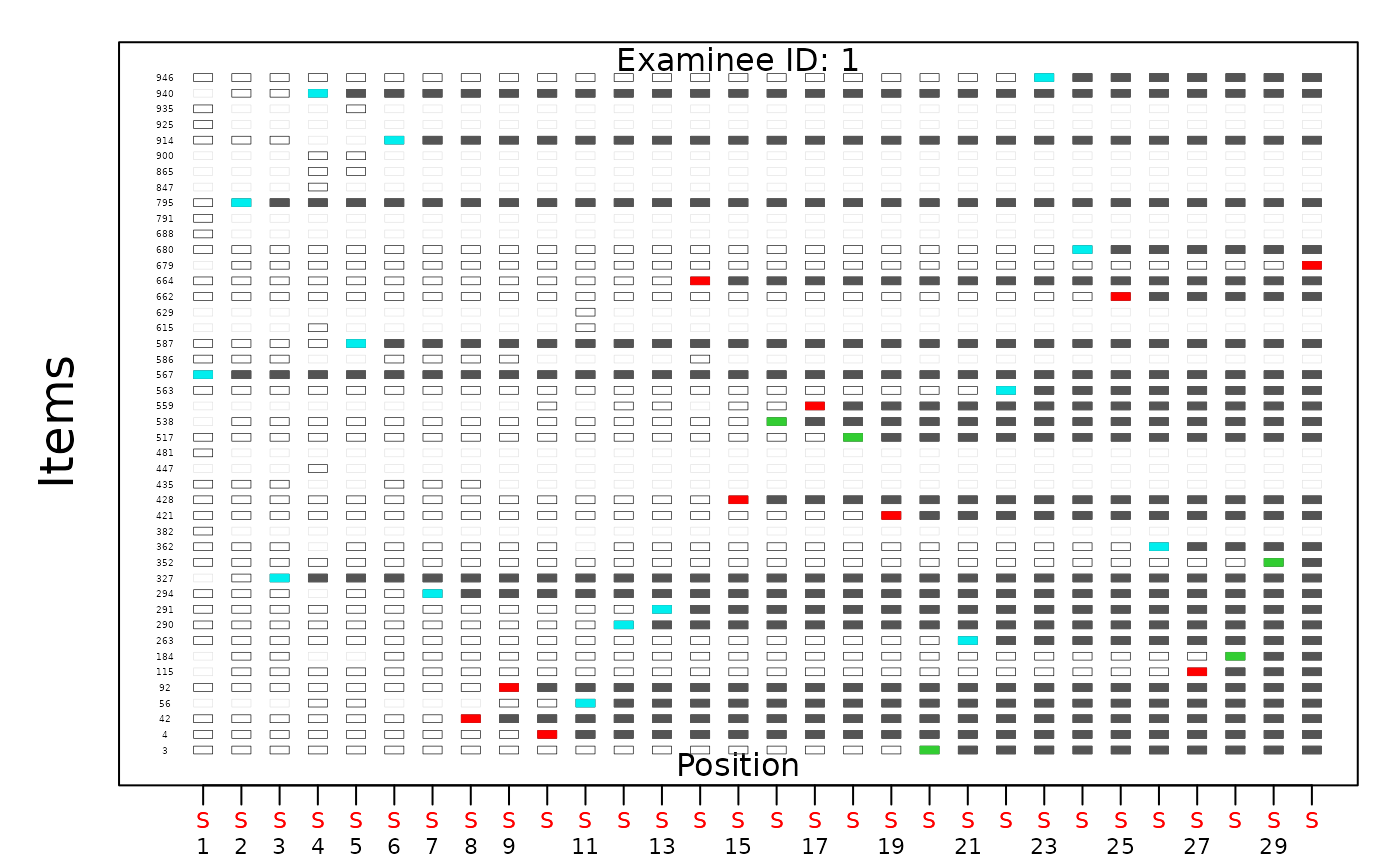
item_pool: plot information and expected scores.constraints: plot information range based on the test length constraint.output_Static: plot information and expected scores based on the fixed assembly solution.output_Shadow_all: plot audit trail, shadowtest chart, exposure rates, and item overlap data from the adaptive assembly solution.output_Shadow: plot audit trail and shadowtest chart from the adaptive assembly solution.
- y
not used, exists for compatibility with
plotin the base R package.- type
the type of plot.
infoplots information fromitem_pool,output_Static, andoutput_Shadow_all.scoreplots expected scores fromitem_poolandoutput_Static.auditplots audit trail fromoutput_Shadow_allandoutput_Shadow.shadowplots shadowtest chart fromoutput_Shadow_allandoutput_Shadow.exposureplots exposure rates fromoutput_Shadow_all.overlapplots item overlap data fromoutput_Shadow_all.
- theta
the theta grid to use in plotting. (default =
seq(-3, 3, .1))- info_type
the type of information. Currently accepts
FISHER. (default =FISHER)- plot_sum
used in
item_poolobjects.if
TRUEthen plot pool-level values.if
FALSEthen plot item-level values, and repeat for all items in the pool.(default =
TRUE)
- select
used in
item_poolobjects. Item indices to subset.- examinee_id
used in
output_Shadowandoutput_Shadow_allwithtype = 'audit'andtype = 'shadow'. The examinee numeric ID to draw the plot.- position
used in
output_Shadow_allwithtype = 'info'. The item position to draw the plot.- theta_range
used in
output_Shadowandoutput_Shadow_allwithtype = 'audit'. The theta range to plot. (default =c(-5, 5))- ylim
(optional) the y-axis plot range. Used in most plot types.
- color
the color of the curve.
- z_ci
used in
output_Shadowandoutput_Shadow_allwithtype = 'audit'. The range to use for confidence intervals. (default =1.96)- simple
used in
output_Shadowandoutput_Shadow_allwithtype = 'shadow'. IfTRUE, simplify the chart by hiding unused items.- theta_type
used in
output_Shadow_allwithtype = 'exposure'. The type of theta to determine exposure segments. AcceptsEstimatedorTrue. (default =Estimated)- color_final
used in
output_Shadow_allwithtype = 'exposure'. The color of item-wise exposure rates, only counting the items administered in the final theta segment as exposed.- color_stim
used in
output_Shadow_allwithtype = 'exposure'ortype = 'overlap'. The color of stimulus exposure rates or stimulus overlap data.- segment
used in
output_Shadow_allwithtype = 'exposure'. (optional) The segment index to draw the plot. Leave empty to use all segments.- rmse
used in
output_Shadow_allwithtype = 'exposure'. IfTRUE, display the RMSE value for each segment. (default =FALSE)- use_segment_label
used in
output_Shadow_allwithtype = 'exposure'. IfTRUE, display the segment label for each segment. (default =TRUE)- use_par
if
FALSE, graphical parameters are not overridden inside the function. (default =TRUE)- ...
arguments to pass onto
plot.
Examples
subitempool <- itempool_science[1:8]
## Plot item information of a pool
plot(subitempool)
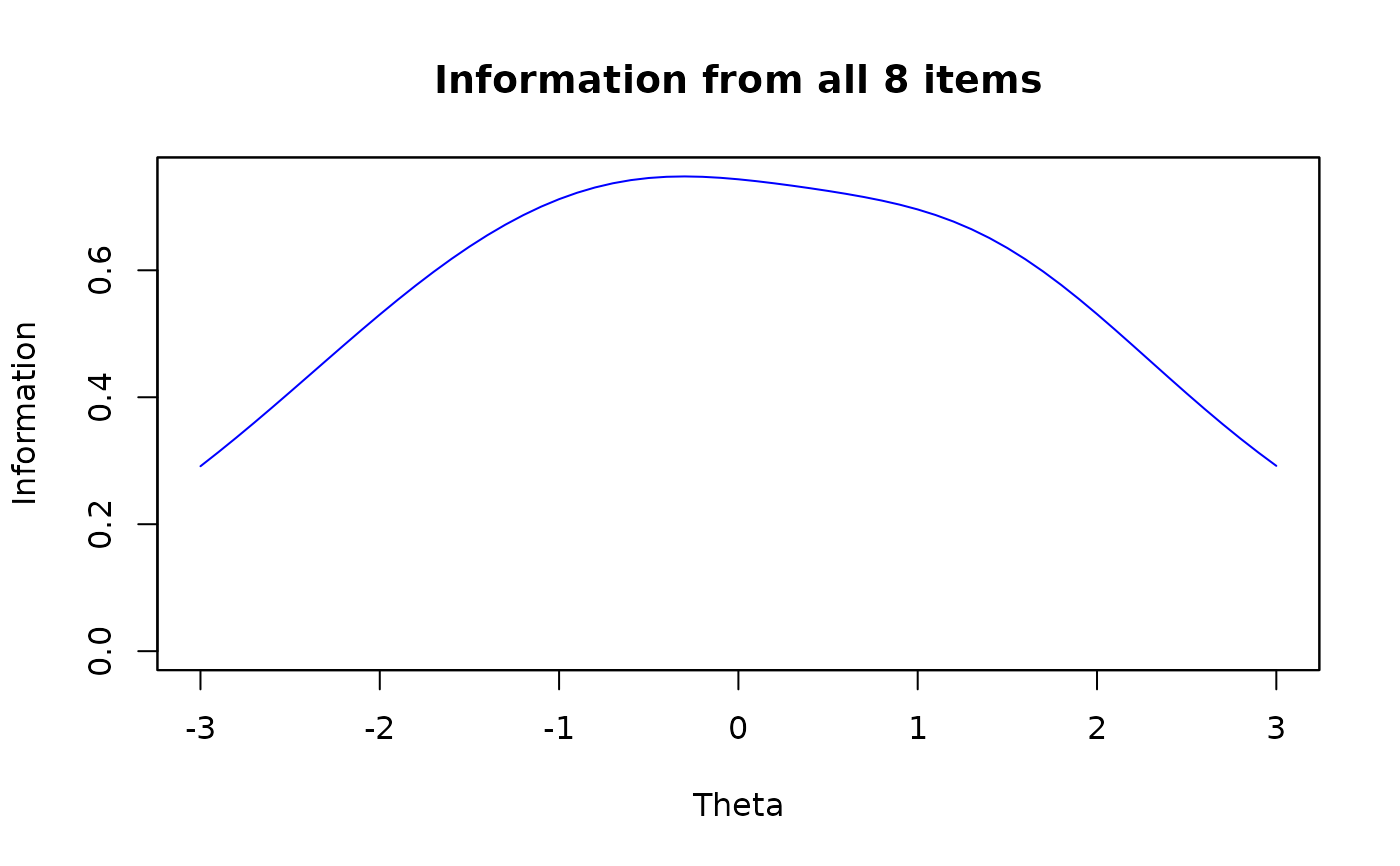 plot(itempool_science, select = 1:8)
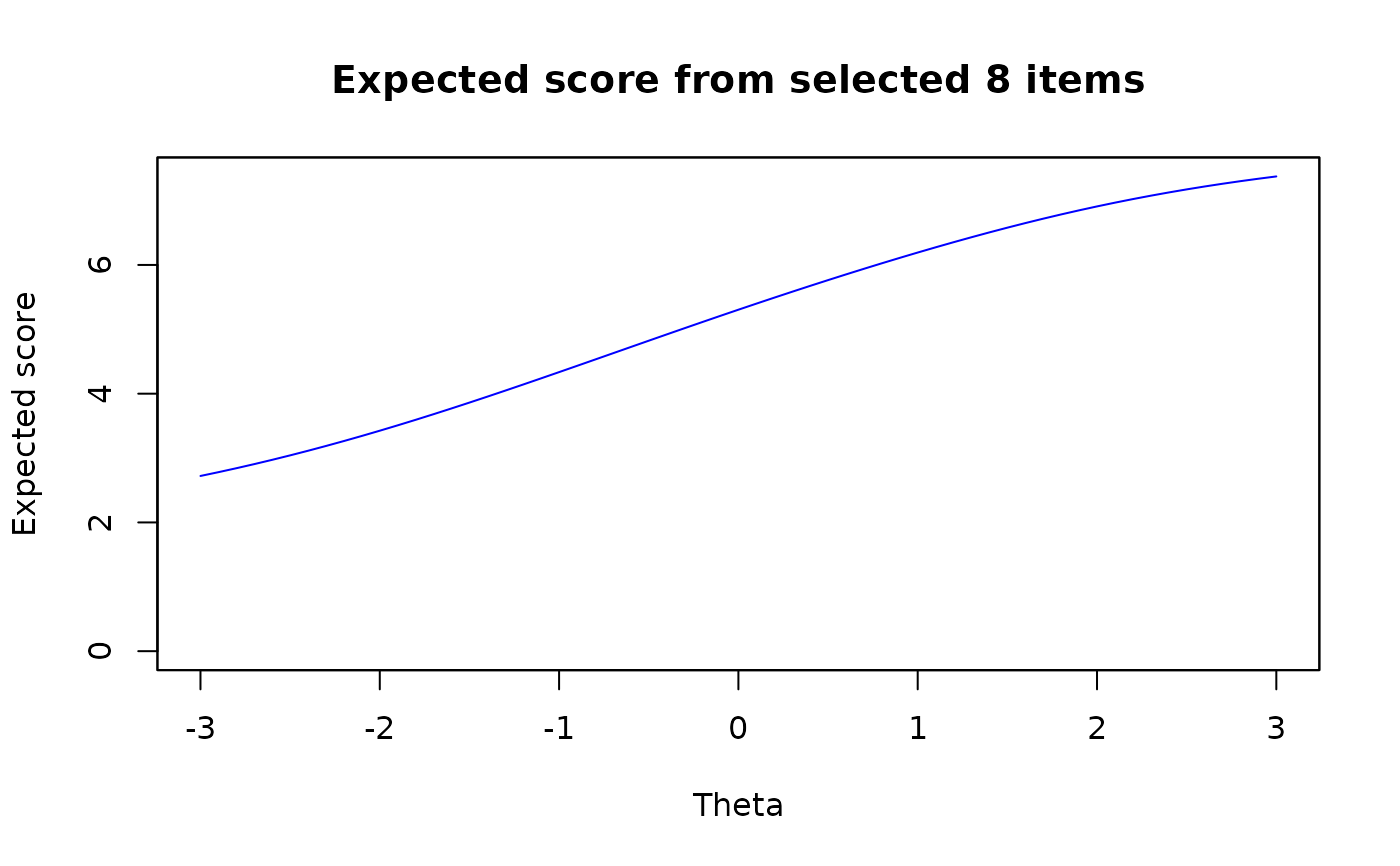
 ## Plot expected score of a pool
plot(subitempool, type = "score")
## Plot expected score of a pool
plot(subitempool, type = "score")
 plot(itempool_science, type = "score", select = 1:8)
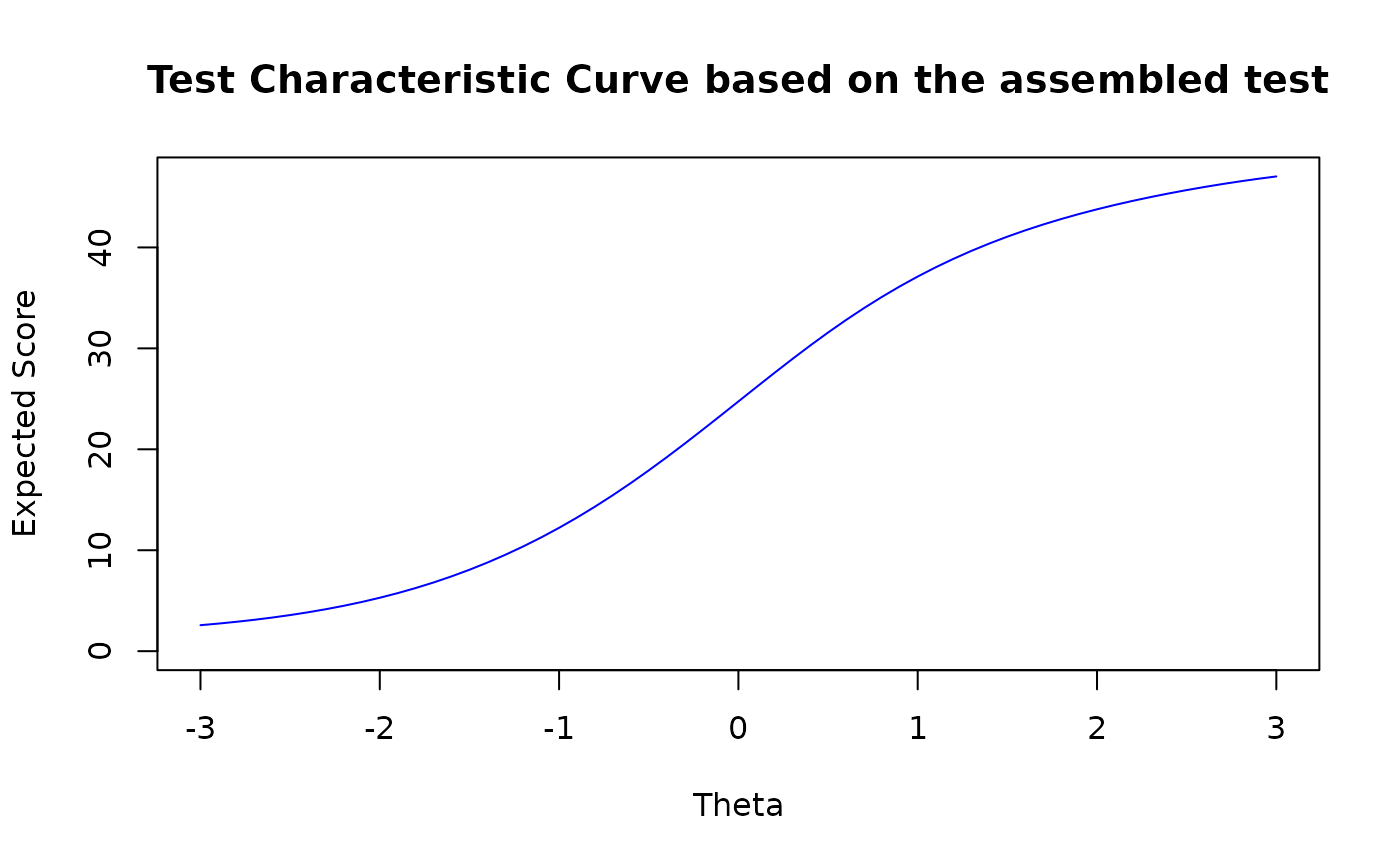
 ## Plot assembly results from Static()
cfg <- createStaticTestConfig()
solution <- Static(cfg, constraints_science)
plot(solution) # defaults to the objective type
## Plot assembly results from Static()
cfg <- createStaticTestConfig()
solution <- Static(cfg, constraints_science)
plot(solution) # defaults to the objective type
 plot(solution, type = "score") # plot expected scores
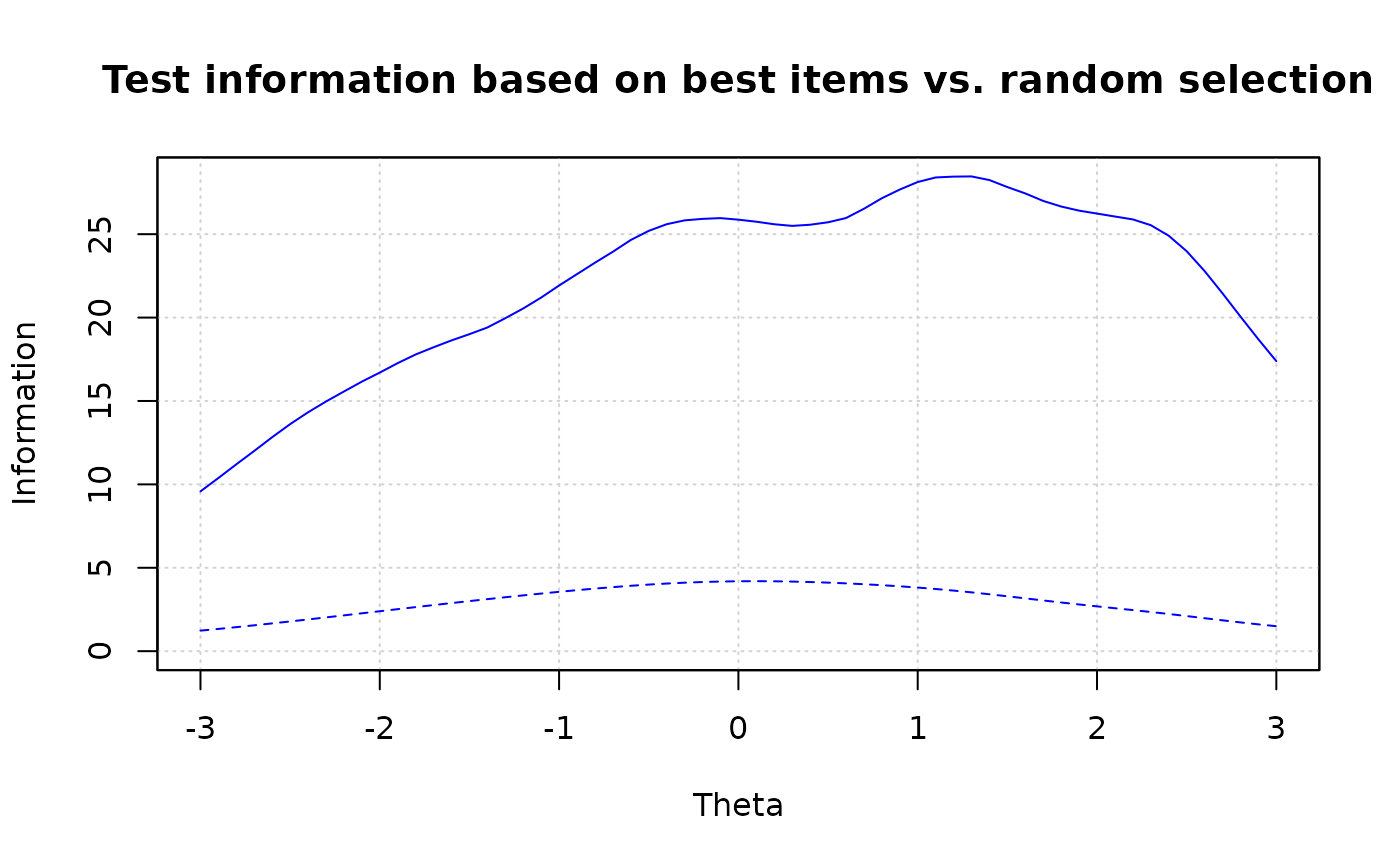
 ## Plot attainable information range from constraints
plot(constraints_science)
## Plot attainable information range from constraints
plot(constraints_science)
 ## Plot assembly results from Shadow()
cfg <- createShadowTestConfig()
set.seed(1)
solution <- Shadow(cfg, constraints_science, true_theta = rnorm(1))
plot(solution, type = 'audit' , examinee_id = 1)
## Plot assembly results from Shadow()
cfg <- createShadowTestConfig()
set.seed(1)
solution <- Shadow(cfg, constraints_science, true_theta = rnorm(1))
plot(solution, type = 'audit' , examinee_id = 1)
 plot(solution, type = 'shadow', examinee_id = 1, simple = TRUE)
 ## plot(solution, type = 'exposure')
## plot(solution, type = 'overlap')
## plot(solution, type = 'exposure')
## plot(solution, type = 'overlap')